Most data related to Mainline Protestant decline focuses on one of two measures:
- Absolute decline (how many fewer members are in the denomination today as compared to a specific year in the past)
- Percentage decline (how much smaller the denomination has become as understood by expressing the membership decline as a percentage)
In this post, I’ll consider these before exploring what I find to be a more helpful measurement of decline. This new measure is also an easier way to understand the relative size of a denomination at any point in time.
Decline in the UCC
All Mainline Protestant denominations have experienced considerable declines in membership over the last seven decades (see Mainline Decline: 1990-2020 for additional data and trendlines). Since I am affiliated with the United Church of Christ, I’ve selected it for further consideration in this post.
Some of my previous posts on this topic include,
- UCC Membership Decline: 2,193,593 to 773,539 (2022)
- UCC Decline Enters 7th Decade (2020)
- 6 Decades of Decline in the United Church of Christ (2018)
- Dwindling Membership: The United Church of Christ from 1965-2015 (2016)
- More Decline in the Mainline: UCC in Florida (2012)
Absolute Decline
The first blog post title listed above, UCC Membership Decline: 2,193,593 to 773,539, illustrates the absolute decline in membership. Simple subtraction shows an absolute decline of 1,420,254 when measuring from the denomination’s formation through 2021.
Percentage Decline
The second blog post listed above, UCC Decline Enters 7th Decade, explored the percentage decline from the denomination’s formation through 2018. Basic math provided the answer: 64.8%.
Decline Reframed
How large was the United Church of Christ’s membership when it was founded in 1957? The easy answer has already been provided: 2,193,593 people.
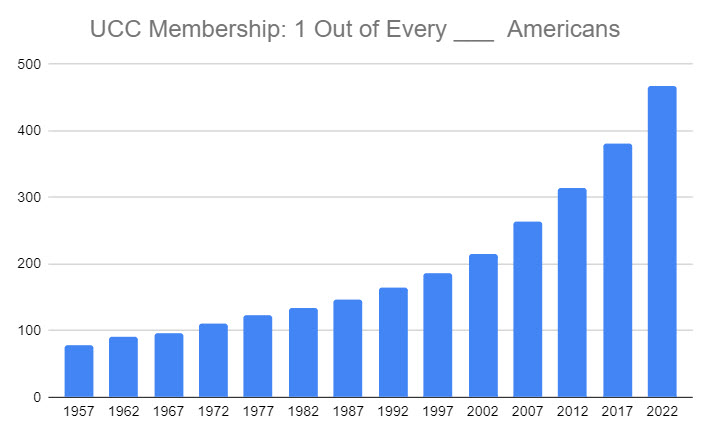
Since none of us sees 2+ million people gathered together on a regular basis (and most of us never see such a crowd in a single place in our lifetime), understanding the size of this population relative to the overall population is helpful. In 1957, the population of the USA was 1,7198,4130. This means that 1.28% of Americans belonged to the United Church of Christ. Or, put differently, 1 out of every 78 people residing in America was part of the United Church of Christ.
Think of all of the times you were in a room with 78 or more people. For most people, it is easy to recall many such occasions for education, recreation, worship, and a host of other life events. And, it is much easier to visualize a group of around this size and then to think of just one person in any given group being part of the UCC.
From 1 of 78 to 1 of 468
While membership in the United Church of Christ has declined over the last 65 years, population in the United States has grown throughout this timeframe.
Observing change in this metric every 5 years from 1957 to 2022, it becomes clear that the relative size of the denomination has been shrinking from the very beginning and that the rate of such decline has accelerated in recent years.

Data from UCC Summary Statistics and US Census Bureau
The transition from being 1 out of every 78 people to becoming 1 out of every 468 has taken 65 years.
So What?
When people talk about membership decline the traditional numbers above would suggest the UCC has declined by 1.4 million people or around 65%.
If, instead, we think of market share, then the decline is actually 3.6 million (3,560,621 people to be precise). In order to be 1 out of 78 people in 2022, the UCC would require a membership of 4,272,917. The actual UCC membership for that year was 712,296.
Chart Data:
| Year | 1 of Every ___ |
| 1957 | 78 |
| 1962 | 91 |
| 1967 | 97 |
| 1972 | 111 |
| 1977 | 123 |
| 1982 | 135 |
| 1987 | 146 |
| 1992 | 164 |
| 1997 | 186 |
| 2002 | 216 |
| 2007 | 263 |
| 2012 | 314 |
| 2017 | 381 |
| 2022 | 468 |