While I’ve written extensively about Mainline decline this is the first time I’ve considered what this decline looks like in my own geography. As someone who has lived all but about a decade of my life in the Dallas – Fort Worth area of Texas, I’ve long wondered what Mainline decline really looks like here in the area I call home.
The exploration that follows offers a county by county look at the region’s most populous counties before exploring Mainline decline for the area as a whole. County level data is provided through the U.S. Religion Census.
Tarrant County
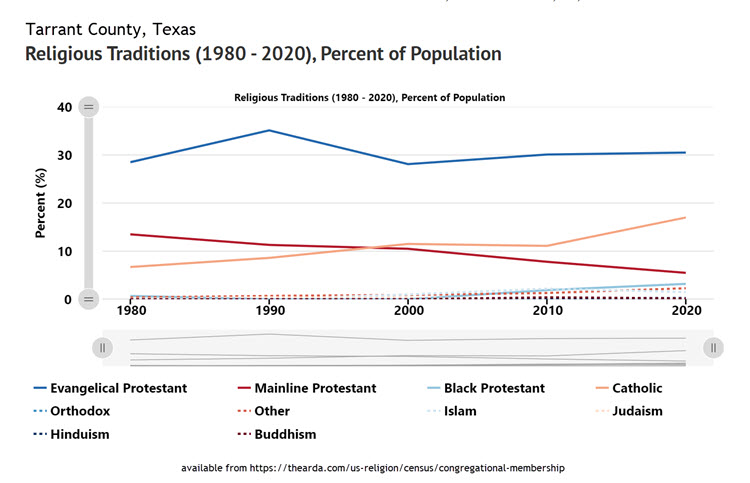
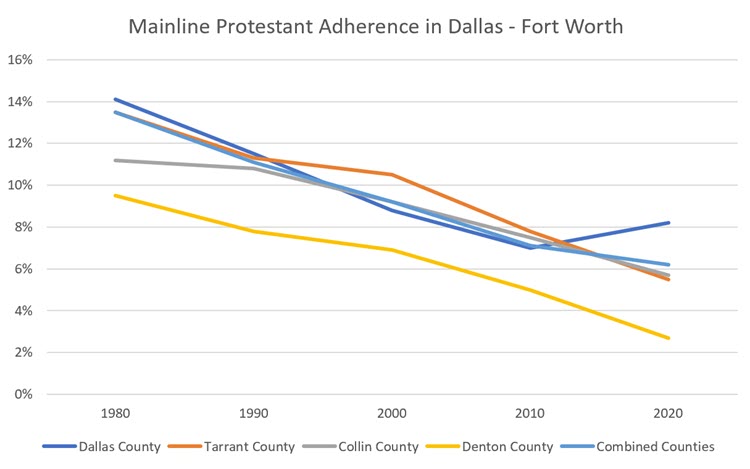
Between 1980 and 2020, Mainline Protestants in Tarrant County declined from 13.5% to 5.5% of the population. By comparison, the percentage of Evangelical Protestants was nearly flat (increasing from 28.5% to 30.5%) while the percentage of Catholics more than doubled (growing from 6.7% to 17%), and the percentage of Black Protestants grew more rapidly than any other Christian group (growing from 0.7% to 3.2%).
Dallas County
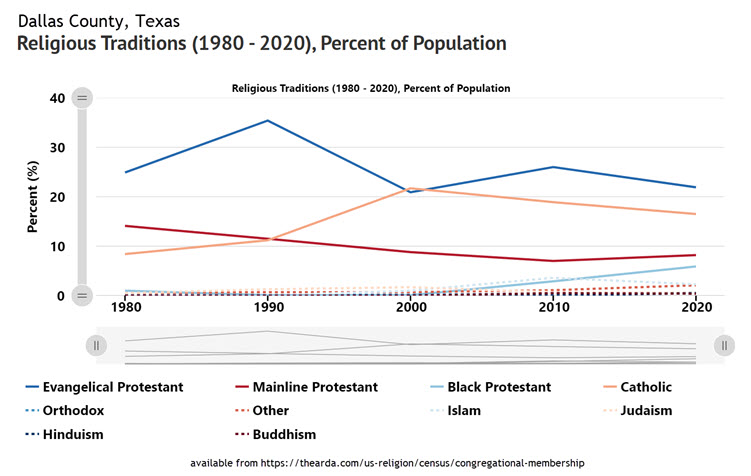
Between 1980 and 2020, Mainline Protestants in Dallas County declined from 14.1% to 8.2% of the population. By comparison, the percentage of Evangelical Protestants was nearly flat (decreasing from 24.9% to 21.9%) while the percentage of Catholics nearly doubled (growing from 8.4% to 16.5%), and the percentage of Black Protestants grew more rapidly than any other Christian group (growing from 1.0% to 5.9%)
Collin County
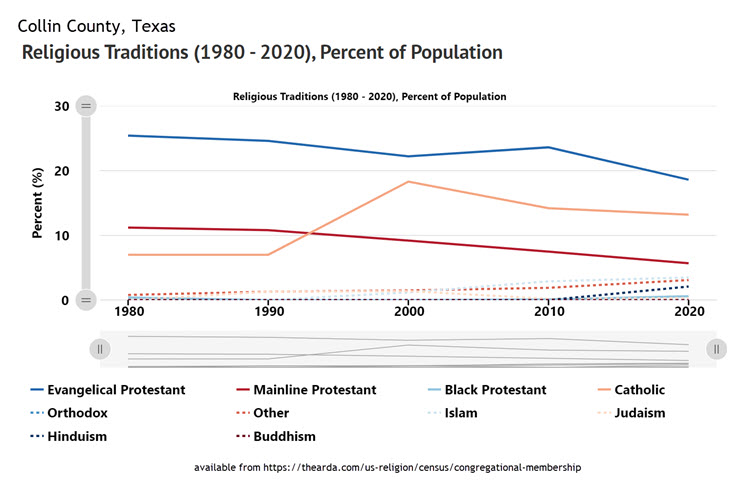
Between 1980 and 2020, Mainline Protestants in Dallas County declined from 11.2 % to 5.7% of the population. By comparison, the percentage of Evangelical Protestants declined by more than 25% (decreasing from 25.4% to 18.6%) while the percentage of Catholics nearly doubled (growing from 7.0% to 13.2%), and the percentage of Black Protestants doubled (growing from 0.4% to 0.6%)
Combined Counties
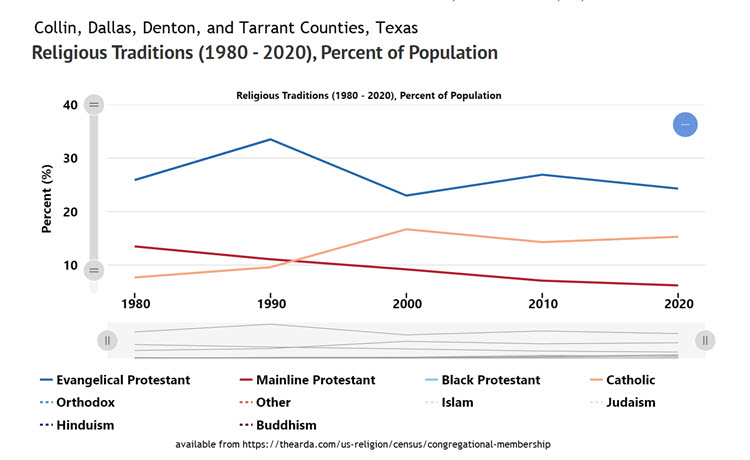
The population of the four most populous counties in the Dallas – Fort Worth statistical area was 6,695,066 in 2020. The total adherents of the religious groups listed above was 3,695,036, which included 55.2% of the total population in 2020.
Between 1980 and 2020, Mainline Protestants in the combined three county area declined from 13.5 % to 6.2% of the population. By comparison, the percentage of Evangelical Protestants was relatively flat (decreasing from 25.9% to 24.3%) while the percentage of Catholics nearly doubled (growing from 7.7% to 15.3%), and the percentage of Black Protestants grew the most dramatically (increasing from 0.8% to 3.5%).
So What?
In three of the four counties the decline is clear and consistent; in Collin, Denton, and Tarrant Counties the percentage of the population identified as Mainline Protestant declined significantly each and every decade from 1980 to 2020. Dallas County is the only county to show growth in Mainline Protestant adherence over the last four decades. In Dallas County, Mainline Protestants grew from 7.0% in 2010 to 8.2% in 2022.
Over the last forty years, I’ve lived, worked, and/or worshipped in the Dallas – Fort Worth’s four most populous counties. Currently, I reside in Tarrant County and work and worship in Dallas County.
In 1980, I was a toddler. As I look at the charts in this post I see the change of my religious tradition (Mainline Protestant) in comparison to the greater religious shifts in my community. In the most basic terms, the percentage of Dallas – Fort Worth area residents who are Mainline Protestant has been cut in half during my lifetime from 13.5% to 6.2%. Or, expressed in simpler and rounded terms, the number of D/FW residents identified as Mainline Protestant dropped from 1 person out of every 7 in 1980 to 1 person out of every 16 in 2020.
For A Broader Perspective on Mainline Decline
- Mainline Decline: 1990 to 2020 (May 2022)
- Mainline: The 5 Percent? (August 2019)
- Will Mainline Protestantism Disappear by 2039? (May 2017)
- Mainline Protestantism = Old (July 2016)
- Fewer and Fewer Christians (& Even Fewer Mainline Protestants) (May 2015)
- From Mainline to Sideline to Oldline (February 2015)
- Shifts in Religious Affiliation (1972-2012) (August 2014)
- Role Reversal (February 2012)
- Liberal Protestant Decline – Fact Check (October 2011)
- What if No One Comes? More Decline in the Mainline (October 2010)
For a Deeper Dive in the Decline of the United Church of Christ
- UCC Membership Decline: 2,193,593 to 773,539 (February 2022)
- UCC Decline Enters 7th Decade (May 2020)
- Majority of UCC Congregations Worship 50 or Fewer (February 2019)
- 6 Decades of Decline in the United Church of Christ (October 2018)
- Dwindling Membership: The United Church of Christ from 1965-2015 (November 2016)
- More Decline in the Mainline: UCC in Florida (February 2012)
For a Deeper Dive in the Decline of the Presbyterian Church (USA)
- The Median Presbyterian (PCUSA) Congregation (January 2023)
- Presbyterian Decline: PCUSA -The First 35 Years (March 2020)
For a Deeper Dive in Other Mainline Denominations
- Another Decade of Major Decline in The Episcopal Church (September 2019)
- From 5 Million to 4 Million (March 2013)