Three common measures of success for local churches are worship attendance, annual budgets, and facilities (sometimes referred to as butts, bucks, and buildings).
Worship Attendance
Congregations vary widely in size. Comparing them based on membership appears attractive until you learn that membership means different things in different traditions, and even within a given denomination individual congregations have different expectations of how one becomes a member and what one must do to remain an active member. A more helpful comparative statistic has been worship attendance, which is the number of people who attend a service in a given house of worship.
At the level of an individual congregation, comparing average weekly worship attendance year over year has long been understood as a key indicator of whether the church is growing, stable, or declining. At the level of many congregations, this provides an individual congregation with some sense of how they compare to others in their denomination or to all churches in a given data set.
Declining Median Attendance
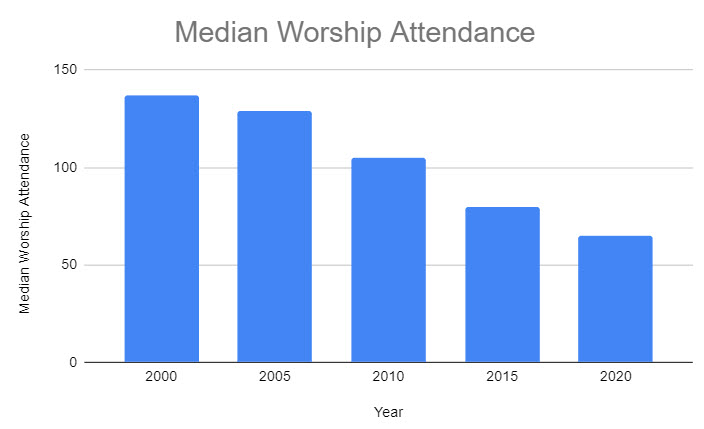
The median attendance in America’s churches decreased by more than 50% between 2000 and 2020.
- 2000: 137
- 2020: 65
So What?
During the first twenty years of this century, the median worship attendance has been cut in half.
This is an alarming statistic, especially since the statistics are primarily from a pre-pandemic world (all 2020 surveys were submitted by mid-March 2020).
What worship looks like week in and week out has been changing rapidly for twenty years. The pandemic did not cause these shifts, it simply accelerated them.
Statistical Definitions – Median & Average
- The median in any data set is the middle point: half of the numbers are larger and half are smaller.
- This is different from average, which is the sum of all of the numbers in a data set divided by the number of numbers in it.
Additional Related Findings from Faith Communities Today
- The number of “small churches” (congregations with worship attendance of 100 or fewer) has increased from 45% in 2000 to 65% in 2020.
- In 2020, significant variation exists in the median attendance of different religious traditions: Mainline Protestant – 50, Evangelical Protestant – 65, and Catholic and Orthodox – 400.
- Congregations of all sizes could be growing or declining. Over the last 20 years the percentage of congregations that are declining has increased while the percentage of congregations that are growing has decreased. Larger congregations are more likely to be growing.
