A few days ago the Pew Research Center published The Religious Typology: A New Way to Categorize Americans by Religion. For those not inclined to read the full 99 page report, Pew also provides an in-depth blog post that effectively communicates the main elements of the research.
Research Basics
Started in 2014, “The American Trends Panel (ATP), created by Pew Research Center, is a nationally representative panel of randomly selected U.S. adults” who “participate via monthly self-administered web surveys” (p.95).
The new report is primarily based on data from the latest survey wave, which included more than 4,200 respondents and occurred in December 2017 (see Appendix B, pages 95-98, for a more complete explanation of methodology).
The 16 questions from the survey that were used to create the new typology are available online for anyone to take free of charge.
If you are curious where you fit in this new typology, simply take the Religious Typology Quiz.
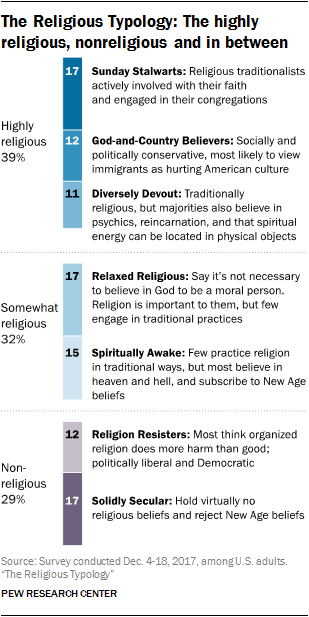
The Religious Typology report sorts respondents into three levels of religiousness. Interestingly, they are almost equal in size.
- Highly Religious – 39%
- Somewhat Religious – 32%
- Non-Religious – 29%
7 American Religious Types
- Sunday Stalwarts (highly religious) – 17%
- God-and-Country Believers (highly religious) – 12%
- Diversely Devout (highly religious) – 11%
- Relaxed Religious (somewhat religious) – 17%
- Spiritually Awake (somewhat religious) – 15%
- Religion Resisters (non-religious) – 12%
- Solidly Secular (non-religious) – 17%
Comparing Mainline and Evangelical Protestants
As someone who writes from a Mainline Protestant perspective primarily for a Mainline Protestant audience, I’m always quick to note how different and/or how alike Mainliners are from Evangelicals.
The full report breaks down each type by religious belonging using the respondent’s denomination as a way to group folks into the Mainline or Evangelical category (p.32).
| Religious
Type |
Mainline | Evangelical | Mainline vs. Evangelical |
| Sunday Stalwart | 20% | 36% | -16% |
| God-and-Country Believers | 9% | 23% | -14% |
| Diversely Devout | 15% | 7% | +8% |
| Relaxed Religious | 27% | 20% | +7% |
| Spiritually Awake | 20% | 11% | +9% |
| Religion Resisters | 3% | 1% | +2% |
| Solidly Secular | 6% | 2% | +4% |
So What?
This research provides a new way of looking at American religious types. After reading the report and associated blog post, writing this blog post, and talking with a few people about this topic I’m certain that I’ve only scratched the surface both of what the data includes and its applicability for my work as an educator, consultant and pastor.
Not surprisingly, Evangelicals best Mainliners in the top two highly religious types. Interestingly, Mainliners best Evangelicals in the final highly religious type and in all types in the somewhat religious and non-religious category.
Only one type is attending worship services on a regular basis: Sunday Stalwarts. Roughly 8 out of 10 Sunday Stalwarts participate in worship at least once a week, which is “three times greater than the share of frequent attenders among God and Country Believers, and roughly seven times larger than the proportion of the Diversely Devout” (p.9).
- Take the Religious Typology Quiz and share your type. Do you agree with this categorization or not? Explain.
- Consider your congregation. Estimate the percentage of active members and other active participants by category.
- Which religious type is most likely to be attracted to your faith community? Why?
