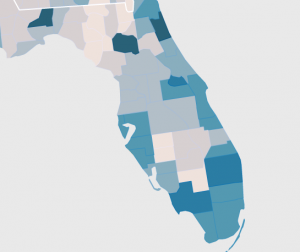
 I grew up with the understanding that a college degree was a part of the path leading to the American dream. A recent Chronicle of Higher Education interactive graphic provides the clearest visual explanation of trends in college degree attainment across the country. The graphic provides county by county analysis of the percentage of adults with college degrees, which can be further sorted by gender or race.
Additionally, the graphic provides the same information for seven different dates. For example, the percentage of American adults with college degrees:
- 1940 – 4.6% (men – 5.5% / women – 3.8%)
- 1950 – 6.0% (men – 7.1% / women – 5.0%)
- 1960 – 7.7% (men – 9.7% / women – 5.8%)
- 1970 – 10.7% (men – 13.5% / women – 8.1%)
- 1980 – 16.2% (men – 20.1% / women – 12.8%)
- 1990 – 20.3% (men – 23.2% / women – 17.6%)
- 2000 – 24.4% (men – 26.1% / women – 22.9%)
- 2005-2009 – 27.5% (men – 28.3% / women – 26.8%)
So What?
A 2012 reality check:
- Those who are retiring were born at a time when only 1 in 20 American adults held a college degree.
- Those who are entering the workforce do so at a time when more than 1 in 4 American adults hold a college degree.
- The increase in the percentage of American adults holding college degrees was close to 4% each decade during the most recent decades.
What impact has this shift had on your local congregation? If the trend continues, what changes would you anticipate over the next few decades? How does this shift compare to other more localized demographic changes and their impact on your congregation?