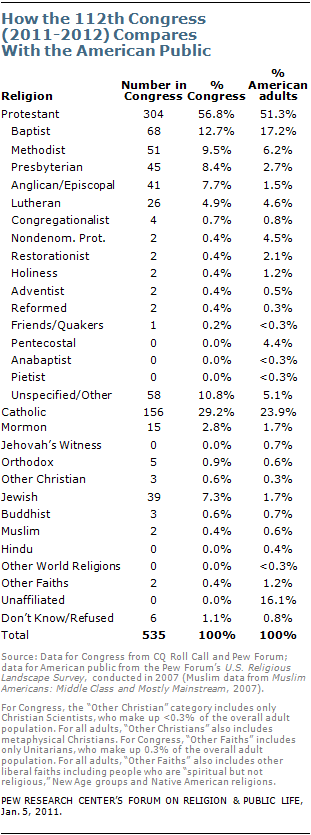
 The Pew Forum on Religion and Public Life posted “Faith on the Hill: The Religious Composition of the 112th Congress” last month. This article explores the religious makeup of both chambers, compares the religious preferences of newly elected officials and incumbents, and provides historical data. Shown at right is a chart showing how varying religions are represented in the 112th Congress and in the American adult population as a whole.
So What?
While some variance between the makeup of Congress and the general population is expected, some of the data reveals variances that exceed most expectations. For example:
Perhaps the greatest disparity between the religious makeup of Congress and the people it represents, however, is in the percentage of the unaffiliated – those who describe their religion as atheist, agnostic or “nothing in particular.” According to information gathered by CQ Roll Call and the Pew Forum, no members of Congress say they are unaffiliated. By contrast, about one-sixth of U.S. adults (16%) are not affiliated with any particular faith.
Take a few moments to struggle with each of the following questions:
- Find your religious group in the chart. Is it under or over represented in the 112th Congress when compared to the general population? Given what you know of your denomination is this over or under representation as you expected?
- Why do you think that the unaffiliated, sometimes called “nones,” are the most underrepresented group in Congress? How might the generational makeup of that group contribute to such a significant gap (for more on this, read my earlier reflections here).